What is Model Portfolio? How do I take advantage of it?
Model Portfolio contains a list of stocks, which qualify CAN SLIM® criteria, and are added to the list on a proper breakout from their pivots (resistance levels). While there may be many stocks which qualify for the above, we ensure that the best and the most ideal of the lot are recommended. Stocks are removed from the model portfolio when they breach our sell-rules, or when they weaken technically. Investors can consider purchasing such stocks, when they are added to the list. The additions are notified through the app and e-mail alerts. It is recommended that stocks are added, when they are within 5-7% price range from their pivot levels. Similarly, investors can remove stocks when they receive the remove alert, which are sent through the app or e-mail
A stock was added to the Model Portfolio last month. Can I buy it?
Buying right solves half of your selling problems. The ideal buy range for a stock is when it is purchased within 5-7% price range from its pivot. Our research shows that buying within the 5-7% range, enables you to sit through most of the normal price corrections in a stock. Therefore, please ensure that you buy stocks only when they are recommended and are not extended more than 7% from their pivot. You should also look at the current market condition, even if the stock is available in the buy range. There is a possibility that the market direction could have changed as our recommendation, and hence it is important to keep an eye on the market trend before making any new purchase. If you like a stock in the model portfolio, but have missed buying it, either because the stock was not available within the ideal buy range or the market direction was unfavourable. Do not worry. The stock market provides ample opportunities in terms of other stocks or new entry points into your favourite stock.
How many stocks should I own? (Ideal number of stocks in a portfolio)
Individual investors with a large portfolio, say of INR 10 lakhs, need not own more than six or seven well-selected stocks. Smaller capital investments should consider holding only three or four stocks. Once you own the required number of stocks and if a tempting opportunity comes along that you think is really great, you must buy more only by selling off your least attractive investments. The more stocks you own, the harder it is to maintain a proper track of them. Additional capital could be used to average-up existing positions, when such stocks break out of proper bases. The objective is to have one or two big winners rather than dozens of small profits.
When do stocks get added/removed to/from portfolio? How frequent would be the changes?
Stocks are added to the MarketSmith India model portfolio based on fundamental and technical strength, using the CAN SLIM® methodology. While many stocks may qualify our CAN SLIM® criteria, they are added to the Model Portfolio, when they breakout from their bases (price consolidation patterns) and when they close strongly near their pivots (previous resistance levels). Stocks are removed from the model portfolio when they breach our sell rules including stop-loss hits (we follow a 8-10% stop-loss rule), and 50-DMA and 200-DMA breaks on huge volume. Stocks could also be removed on an account of profit booking (20-25% or higher). Stocks showing technical weakness, without strictly breaching the above sell rules are also considered for removals. Stocks are added and removed, based on the volatility of the market. Our research has shown that three of four stocks trend along with the general market. If the market is in a Confirmed Uptrend, the green signal remains on for new stock purchases. Similarly, when the market is in a Downtrend, we generally avoid adding any number of stocks to the model portfolio..
What should be the minimum portfolio size to take advantage of MarketSmith India model portfolio (1 lakh, 10 lakh?)
Stocks provide an advantage of investing in even with the smallest of token sizes. While we do not provide any emphasis on the size of the portfolio, per se, we recommend investors to not hold too many stocks in their portfolio. Smaller capital investments should consider holding not more than three or four stocks. Individual investors with a large portfolio, say of INR. 10 lakhs or more, need not own more than six or seven well-selected stocks.
How many stocks will you have in the MarketSmith India model portfolio? Should I hold all of them?
The number of stocks in the model portfolio could range anywhere from 1 to 40. The model portfolio represents Model stocks, and how to enter them at their Ideal buy points. While it is not advised to add every single model portfolio stock to your portfolio, investors are advised to select the best of the stock ideas which appeal to them. Holding a few good ideas can generate the required returns, when purchased at proper buy points, and when strict sell-rules are followed. While the model portfolio could have a higher number of stocks, going up to 40, it is only an indicative list on screening for CAN SLIM® stocks and entering them at their ideal buy points. Please note, the model portfolio performance has beaten the benchmark; inspite of the number of stocks in the portfolio indicating the effectiveness of the CAN SLIM® growth strategy.
What is the benchmark index of the model portfolio?
The Nifty 50 has been the benchmark selected to evaluate the performance of the MarketSmith India model portfolio. The model portfolio could comprise any of the micro, small, mid, or large cap stocks, which qualify our liquidity criteria, resulting in the general market to be our universe. The performance of the model portfolio has well-beaten the benchmark from inception, even after adjustments for regular trading fees, implying the effectiveness of the CAN SLIM® growth strategy. Important Note: The model portfolio is run with an objective to provide effective stock ideas to the investor, and not strictly with an objective to beat the benchmark. While we are happy to assume responsibility to track the performance of our recommendations, we believe running a model portfolio, with an objective to purely generate alpha using the CAN SLIM® methodology, could generate far superior returns.
When will I be notified about a stock addition or removal?
Subscribed users are notified of any additions or removals to the model portfolio through a notification from the MarketSmith India app, and an e-mail alert to the registered e-mail of the user. The app and the e-mail alerts contain information including the add/remove prices for the stock, market cap, volume, industry details, stock research, etc. Alternatively, one can refer the model portfolio section.
What is Growth 50 list and will there be common stocks in Growth 50 and Model Portfolio?
The Growth 50 list is algorithmically generated list of the top growth stocks in India, with strong fundamental and technical characteristics. The list gets updated on a weekly basis, and can have stocks that may or may not be available at their ideal buy points. There is a likely possibility that there could be common stocks in Growth 50 and the model portfolio.
Will I get notification of addition/removal on Growth 50 list?
No, there is no notification sent on the Growth 50 list. The list gets updated on the product every Friday, close of business. Please click on the Growth 50 tab to see the list. The list also includes Recent Additions and Recent Removals tab.
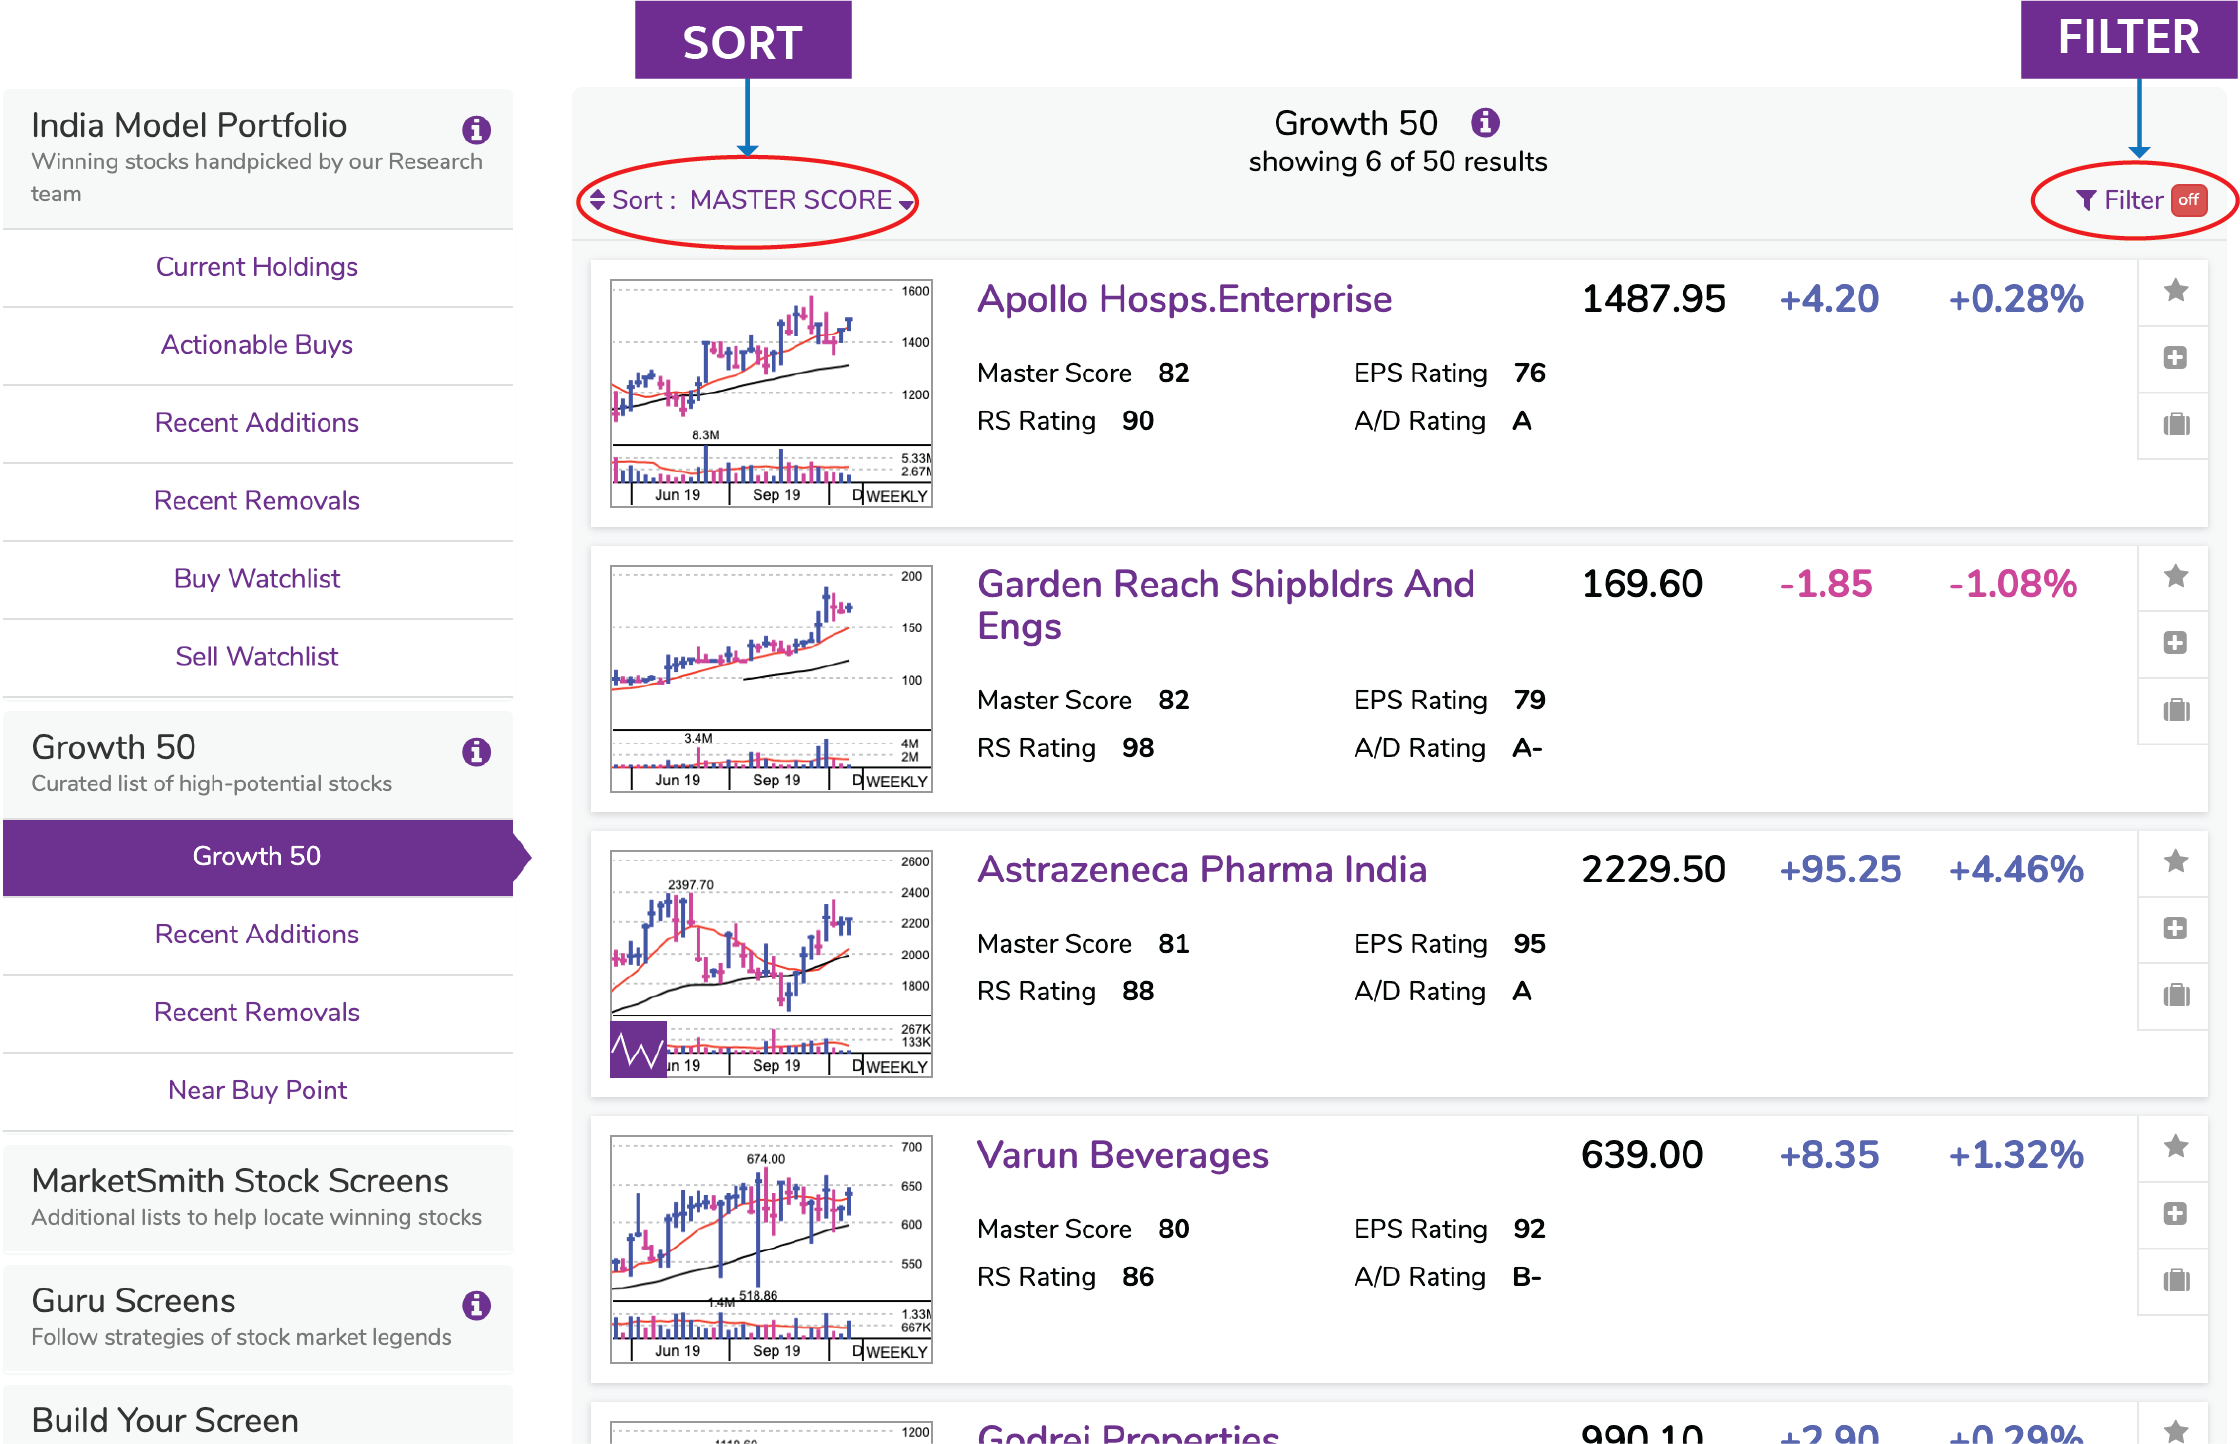
How do I use Growth 50 list?
Growth 50 provides you with algorithmically generated list of the top growth stocks in India. One can then filter out top stocks using "TOP STOCKS-NEAR BUY POINT." However, the list does not consider the chart patterns. Once you select any stock, you should research further and wait for the ideal buy point before taking the final decision on that particular stock.
How do I screen stocks based on certain parameter?
On clicking Filter India Stocks under Idea Lists, you can see an option to Filter and sort the list of stocks. The list of stocks can be filtered by five of our proprietary ratings (Master Score, EPS Rating, Price Strength, Buyer Demand, and Group Rank) and eight other common parameters (Market Cap, Average Daily Volume, % off High, Volume % change VS. 50-DMA, Daily Price % Change, Current price, ROE%, % VS. Pivot.
Refer image below:

Where can I see your recommended stocks?
You can refer to Current Holding in India Model Portfolio list or the Growth 50 list for our recommendations. Please note, Growth 50 is an algorithmically generated list and it gets updated once a week, every Friday.
How do I get a list of stocks from the top 20 Industry Groups?
Click the Idea Lists button on the home page, followed by the "Filter India Stocks" button under the "MarketSmith Reports" panel. Once this is completed, tap the button on the top right corner labelled either as "Filter Off" or "Filter On." This section enables you to create your custom stock screens using various criteria, including MarketSmith India's proprietary ratings and rankings. You can view stocks using the "Group Rank" button, which are great (1-20), good (21-40), fair (41-60), or poor (61-197). You can use the additional filters to customize and strengthen your list of stocks.
What are the initial criteria applied before CAN SLIM® criteria is used?
At MarketSmith India, we look at two criteria for the initial screening of stocks before and further examining for CAN SLIM® traits.
Why do you send out recommendations post market hours?
CAN SLIM® methodology would gauge the breakout based on the close price and the volume of the day. Stock closing above the pivot with above average volume indicates strength and hence, we recommend stocks post market hours.
How do I select four to five stocks from the Model Portfolio?
The number of stocks in the model portfolio could range anywhere from 1 to 40. The model portfolio represents Model stocks and how to enter them at their "Ideal" buy points. While it is not advised to add every single model portfolio stock to your portfolio, investors are advised to select the best of the stock ideas which appeal to them. Holding a few good ideas can generate the required returns, when purchased at proper buy points, and when strict sell-rules are followed. While the model portfolio could have a higher number of stocks, going up to 40, it is only an indicative list on screening for CAN SLIM® stocks and entering them at their ideal buy points. Please refer Current Holdings Near Buy Point for actionable stocks at any given point of time.
Can you give a target price and time period?
We do not recommend stocks based on a specific time period or target price. Our model portfolio recommendations have spun as short as a few days or weeks, or it could even take few months before they generate the desired level of returns (20-25% profit booking level).
The CAN SLIM® methodology follows the below sell-rules.
Can I buy a stock, if it is trading below the recommended price?
At MarketSmith India, we would ideally take a new position in a stock within a range of 5% from its Pivot price. It means that the lower limit of the buy range would be the pivot price, and the upper limit is 5% over the pivot price. In case the stock price falls below this buy range, it is suggested to wait for the stock to come back into the buy range before exercising new buy orders. However, if the investor is convinced and confident about the growth story, he may as well take an aggressive entry that would help in capturing the up-move from current price to pivot. By this we mean that even if the stock falls below the buy range, after our recommendations, a good quality stock will eventually move up in the subsequent trading sessions.
What is Evaluation?
The MarketSmith India Evaluation gives you an unbiased instant assessment of more than 3,900 stocks. Quickly evaluate a stock's rank with our Master Score, a summary proprietary rating, which is based on the EPS, Price Strength, Buyer Demand, and Group Rank ratings.
The Evaluation view is composed of a stock chart and the stock-specific data in the Details Tab. This view efficiently combines the key stock information you need to validate your decision to buy or sell or to commit to further research.
The Chart Overview support content will provide you with an orientation of the data items available on the chart and how they may be used to quickly evaluate a stock.
The Details tab breaks down the data grid so that you can better understand the comprehensive fundamental and technical stock information available.
The Related tab gives the list of top stocks in the Same Industry Group by Master Score and by Relative Strength
The CAN SLIM® Checklist provides a list of CAN SLIM® parameters along with ratings for a specific stock and its grade in terms of Pass or Fail; the higher number of Pass grade, the better the stock quality.
What is Master Score Rating?
The MarketSmith Master Score combines characteristics of the most successful stocks into one easy to use rating. The formula incorporates earnings growth, relative price strength, price-volume characteristics, industry group relative strength, and other factors. In general, concentrate your investment research on stocks with a rating of B or better.
What is EPS Strength?
Great earnings growth is what separates the best stocks from crowd. But it is not enough to just have one or two periods of solid growth. A standout stock needs both a sound growth record in recent years, and a strong current earnings record in the last several periods. As a shortcut for identifying such stocks, the MarketSmith developed its Earnings per Share (EPS) Rating. Indian stocks are ranked on a 1-99 scale with 99 being the best. The MarketSmith India suggests focusing your efforts on stocks with an EPS Rating of at least 80.
What is Price Strength?
Human nature being what it is, most people invest backwards. They want to buy what is the down the most and sell what is up. The best stocks are superior price movers even before their big price moves. You should look for stocks with price leadership. The MarketSmith Relative Strength (RS) rating shows you which stocks are the best price performers by measuring the stock's performance over the previous 12 months. That performance is then compared with the performance of all other publicly traded companies in India on 1-99 scale, with 99 being the best. MarketSmith India suggests focusing your efforts on stocks with an RS Rating of 80 or more.
What is RS line?
Relative Strength (RS) Line: The relative strength line compares a stock's price performance versus the benchmark / index. Many charting services plot a RS Line along with the stock's price, moving averages, etc. The line is derived by dividing the stock price by the benchmark / Index value. An upward sloping line means that the stock's price is outperforming the benchmark / Index.
What is Buyer Demand or Accumulation/Distribution Rating?
Professional investors wield a huge amount of influence over stock's price. Thus, it is essential that you buy the better stocks that professionals are buying and you may sell or avoid the ones that they may be selling heavily. A quick way to keep a track of the end results of professional trading is the MarketSmith Accumulation/Distribution Rating, which is based on daily price and volume changes. It tells you, whether your stock is under accumulation (professional buying) or distribution (professional selling). Stocks are rated on an A-E scale, with A being the best. Generally, you should confine your purchases to C or better.
What is Industry Group Rank?
The majority of leading stocks are usually in leading industries. MarketSmith India studies show that roughly half of stock's move is driven by the strength of its respective group. MarketSmith India divides stock into 197 industry groups. It then ranks them on six-month price performance, with the number 1 group being the best performer. Concentrate your research on stocks in the top 40 groups.
What is Pattern recognition?
The founder of MarketSmith, William J. O'Neil, is one of the pioneers of technical stock analysis. In the studies conducted to identify of what works in the stock market are key patterns on stock charts that many of the biggest winners formed before they went on to huge gains. MarketSmith India's Pattern Recognition feature helps you spot these patterns.
The Pattern Recognition feature includes the following elements:
Chart Pattern: The solid dark green underscore identifies the pattern.
Pivot Line: The dashed dark green line represents the pivot line. When a stock passes the pivot line, it is a sign of technical strength. This is an ideal entry point to buy a stock.
Tight Area: Aqua blue highlights represent Tight Areas, which are identified when a stock closes within a 1.5% price range for at least three consecutive weeks. Tight Areas can be a sign of strength and serve as alternate entry points.
Can we see real-time price and volume on the product?
All intraday quotes on MarketSmith India are delayed by about 20 minutes.
What does green, blue and pink shade in charts indicate?

What is Market Condition?
The general direction of the stock market affects individual stocks, corresponding to it the tide raises or lowers all ships. Understand the market's impact on your stocks which makes you know whether to set sail or be an abandoned ship. MarketSmith India has an objective way of analyzing the market, and we classify the market into four different conditions.
Confirmed Uptrend: Best time to buy stocks
Uptrend Under Pressure: Proceed with caution
Market in Correction: Avoid fresh buys
Rally Attempt: Wait for the market to follow through or strong price action in leading stocks before acquiring new positions
What is PortfolioSmith?
PortfolioSmith is a portfolio evaluation tool that uses algorithms to provide a quick analysis of your portfolio or its constituent stocks and make recommendations based on the CAN SLIM methodology. You can evaluate your current portfolio to make sure you are on the path to maximize wealth creation. PortfolioSmith makes it easy to diagnose your stock ideas and see if they earn a pass, neutral, or fail score for the ratings and other critical technical and fundamental factors.
Who is analyzing my portfolio?
PortfolioSmith algorithmically evaluates your portfolio and provides recommendations based on the CAN SLIM methodology by using machine learning and AI. We are trying to incorporate all aspects an analyst would look into. This helps us provide an unbiased report/evaluation in less than a minute for up to 100 stocks.
Why 13 or 52 reports per quarter/year?
We believe evaluating your portfolio once a week will give you vital insights to take further steps to protect capital and maximize wealth creation.
How can I upload my transactions?
You can upload your transactions using one of the following options:
What is the rationale for recommendations?
We base our recommendations on the CAN SLIM growth investing strategy. It considers both fundamental and technical aspects to give BUY/SELL ratings.
What is the rationale for increasing or decreasing allocation in a particular stock?
We use portfolio allocation models to arrive at the optimal allocation for each stock in the portfolio.
How often do the recommendations change?
There is no fixed time period for the change in recommendations. Since price and moving averages are also considered, the recommendations can change as early as one day or continue to remain the same for a longer duration too.
Should we enter split adjusted prices?
No, you can enter your actual buy and sell prices. The system will apply the required split factors.
Why does it say "We do not support short selling transactions, please exclude them or include the corresponding Buy transaction too"?
The analysis does not consider short selling. Please make sure you have included the corresponding buy transaction for each sell. The sell quantity for a stock should be less than or equal to the buy quantity of the stock. Also, make sure the buy transaction date is older than its sell transaction date.
Why is the performance section blank?
The performance section includes best winners/exclusions and worst losers/exclusions. This is arrived at by considering the position you have closed. In case you have not included any closed position/sell transactions, this section will not populate.
What if I don't use all my 13 reports within the 90 days?
The monthly, quarterly, and annual subscription is valid only for 30, 90, and 365 days, respectively. If you do not generate the given reports, they will expire/lapse at the end of your subscription days.
Is there any transaction cost that you consider while calculating Profit/Loss?
No, we do not consider transaction cost in our calculations.
The report asks me to sell certain stocks. Which stocks should I buy now?
The tool identifies weak stocks for SELL recommendations. Also, if you are over invested in any particular stock, you will be asked to REDUCE. This will lead to cash balance. To know which stock you should buy, you can subscribe to our Model Portfolio or Algos in QuantSmith.
Email us at marketsmithindia@williamoneilindia.com if you have any additional questions.
Disclaimer:
William O Neil India Investment Adviser division, is one of the divisions of William O Neil India Private Limited, which is a company incorporated under the Companies Act 1956. William O Neil India Investment Adviser division is a registered investment advisor with the Securities and Exchange Board of India and through its online product, MarketSmith India intends to provide quality equity research material and information to its customers. The investments discussed or recommended through MarketSmith India may not be suitable for all investors and hence, you must rely on your own examination and judgement of the stock and company before making investment decisions. Data provided through MarketSmith India is for information purposes only and should not be construed as an offer or solicitation of an offer to buy or sell any securities. Information and discussions made available through MarketSmith India contain forward looking statements that involve risks, uncertainties and assumptions that could cause actual results to differ materially from those contemplated by the relevant forward-looking statement. William O'Neil India Investment Adviser division or its employees / directors or any of its affiliates are not responsible for any losses that may arise to any person who has made investments based on the contents of this document. Past performance never guarantees future results. Investment in equities are subject to market risks and despite the best efforts to provide market leading research, William O’Neil India would like to exhort its users to acknowledge and fully understand the risks involved which might include but not limited to loss of both principal and income. Data and content provided through MarketSmith India is to be consumed only by the intended recipient and must not be redistributed any further. Performance results do not represent actual trading and may not reflect the impact that material, economic, and market factors might have had on the investment-making process if actually managing client money. There is substantial speculative risk in most stocks. Performance computations reflect a time-weighted rate of return and includes a brokerage of 0.5%. All holdings are rebalanced to equal rupee amounts daily. Dividends are not considered in computations. Percent gains and losses are calculated for all issues that remain on the “Current Holdings” at the end of the day. For stocks that were added to “Current Holdings”, the basis used to calculate the percent change is the price noted when the issue appeared as a “Current Holdings” in MarketSmith India. For stocks that were removed, the selling price used to calculate the percent is the price noted when the issue appeared as “Removed” in the MarketSmith India. For more information, see our Legal disclosures here.
Registered office address: Technomark Building, A-4, NGEF Ancillary Industrial Estate, Graphite India Road, Mahadevapura, Whitefield, Bangalore 560048, Phone: 080-46802222, Fax: + 91 80 6745381, Website: http://www.williamoneil.com/india/, For investor queries: queries@marketsmithindia.com; For grievances: grievances@marketsmithindia.com; For compliance officer: compliance@marketsmithindia.com, Corporate Identity Number: U74999KA2012FTC066881, Investment Adviser SEBI Regn. No: INA200005125 valid till 11 July 2021.